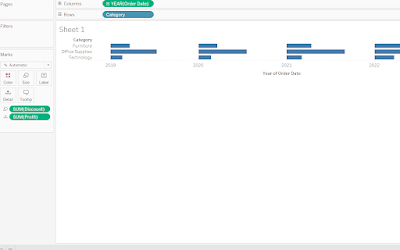
A Gantt view chart is a visual representation of project schedules or timelines. It provides a comprehensive view of tasks, their durations, and their dependencies. Gantt charts in Tableau are useful for project management, resource allocation, and tracking progress. They allow you to plan, monitor, and communicate project timelines effectively.
To create a Gantt view chart in Tableau, follow these steps:
Step 1: Prepare your data
Ensure that your data is structured appropriately. It should contain information about tasks, their start dates, durations, and any dependencies. Each task should have a unique identifier, and the data should be sorted chronologically.
Step 2: Connect to your data source
Launch Tableau and connect to the data source that contains the project schedule data. This could be an Excel file, a database, or any other supported data source.
Step 3: Create a new worksheet
In Tableau, go to the worksheet tab and create a new worksheet. This will serve as the canvas for building your Gantt view chart.
Step 4: Drag and drop the necessary fields
From the data pane, drag the fields representing task names (e.g., "Task Name"), start dates (e.g., "Start Date"), and durations (e.g., "Duration") to the Rows shelf. Arrange the fields in the desired order.
Step 5: Change the chart type
By default, Tableau might display the data in a bar chart or other chart types. However, we need to change the chart type to create the Gantt view chart. In the Marks card, click on the drop-down menu and select "Gantt Bar" chart type.
Step 6: Adjust the chart settings
Customize the appearance and behavior of the Gantt view chart as desired. You can modify the color, size, tooltips, and other formatting options using the various tools and menus available in Tableau.
Step 7: Add additional elements
Consider enhancing the Gantt view chart with additional elements to provide more context or insights. This could include adding reference lines, labels, annotations, or other relevant data.
Step 8: Save and share
Once you are satisfied with the Gantt view chart, save the workbook and share it with others. You can export the chart as an image or publish it to Tableau Server or Tableau Public for wider distribution.
For example, let's say you have a project with four tasks: Task A, Task B, Task C, and Task D. The start dates and durations for each task are as follows:
Task A: Start date - 2023-01-01, Duration - 10 days
Task B: Start date - 2023-01-05, Duration - 8 days
Task C: Start date - 2023-01-08, Duration - 6 days
Task D: Start date - 2023-01-14, Duration - 5 days
By following the steps mentioned above, you can create a Gantt view chart that visually represents the project timeline. The chart will display the tasks on the y-axis and the corresponding bars representing the start dates and durations on the x-axis. You can add labels, adjust the colors, and customize the formatting to improve the clarity and readability of the Gantt view chart.
The resulting Gantt view chart will provide a clear visualization of the project schedule, task durations, and any dependencies, allowing stakeholders to understand the timeline and track progress effectively.
Thanks for Reading, Subscribe us for more latest Visualization From scratch.

No comments:
Post a Comment
If you have any doubts. Please let me know